Cyber ​​projects

Opora

More Projects:

The Company &
the Product

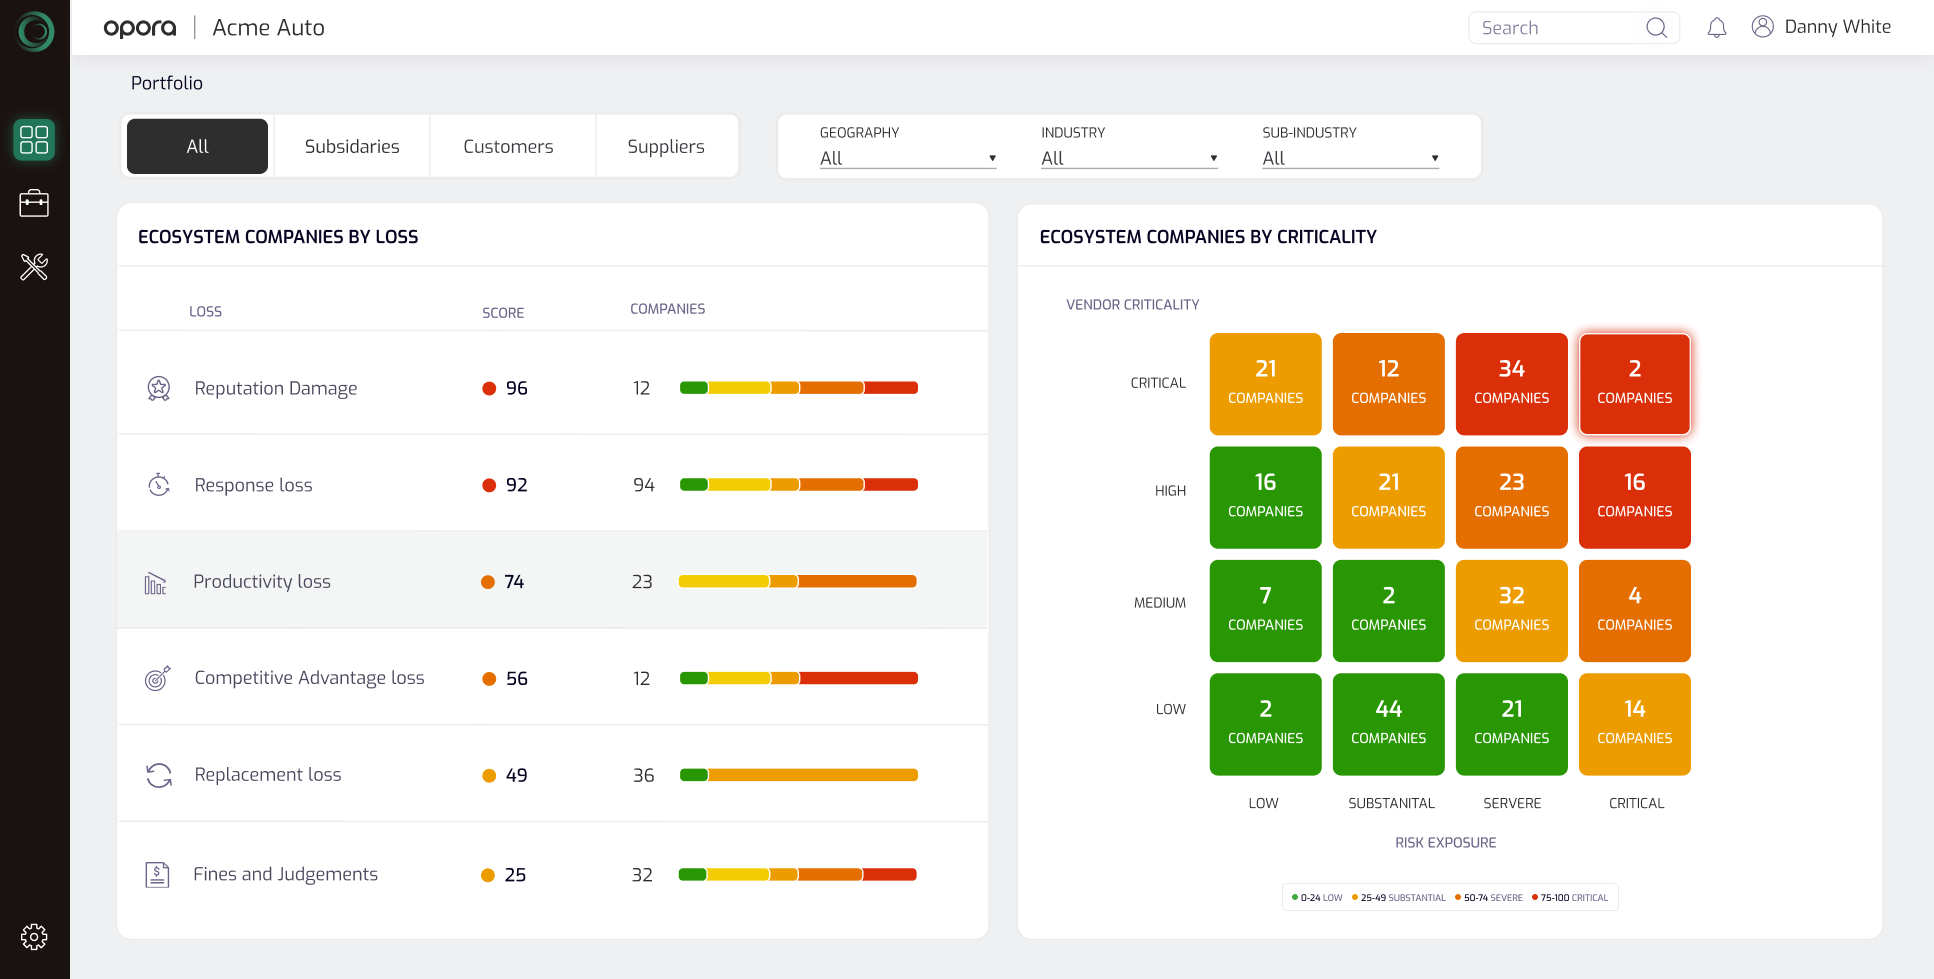
OPORA, the cyber company founded by former Shin Bet director Yuval Diskin, built a genuinely disruptive technology. Where conventional tools probe an organization’s “perimeter,” hunt for vulnerabilities and then recommend how to “patch the holes in the fence,” OPORA’s platform operates outside the corporate network – detecting attacker behavior and mapping risk across the entire business ecosystem: geographies, industries, suppliers, customers, competitors, subsidiaries and more. It fills the missing piece of the risk equation (Risk = Vulnerability × Threat) across the full ecosystem, delivering not just an organization’s overall risk level but the real business implications behind it.

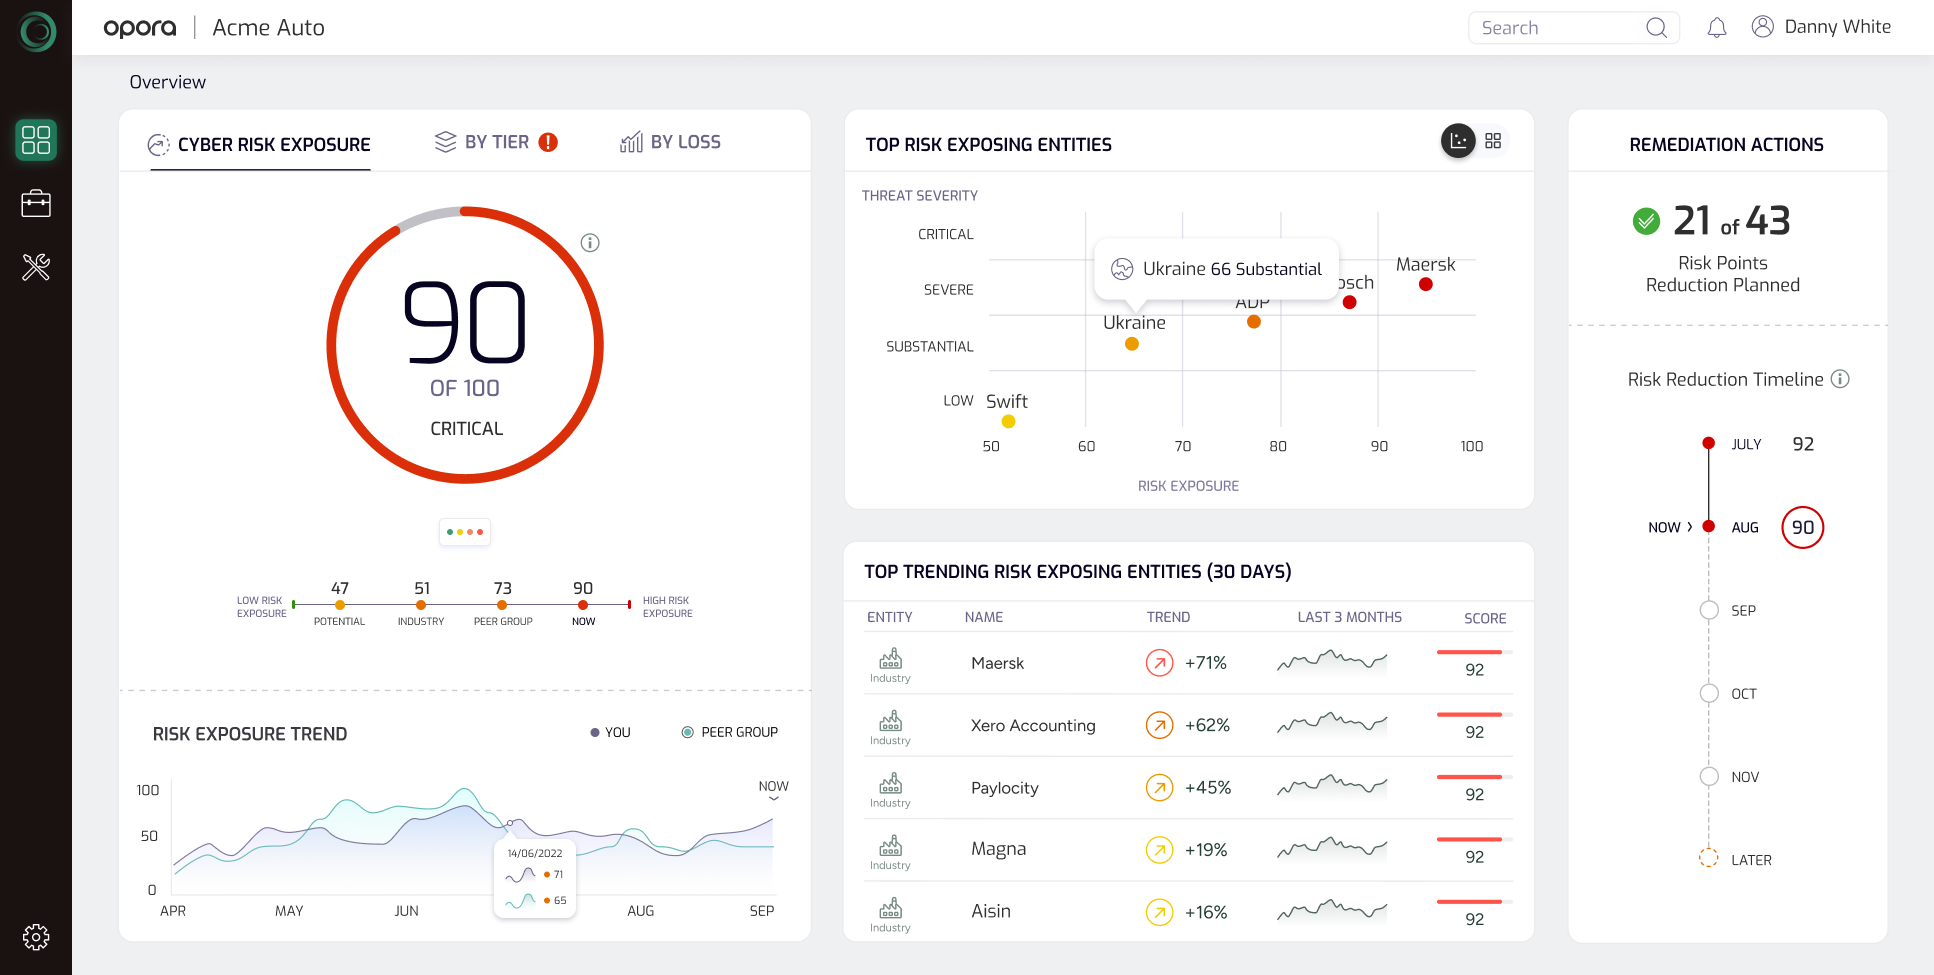
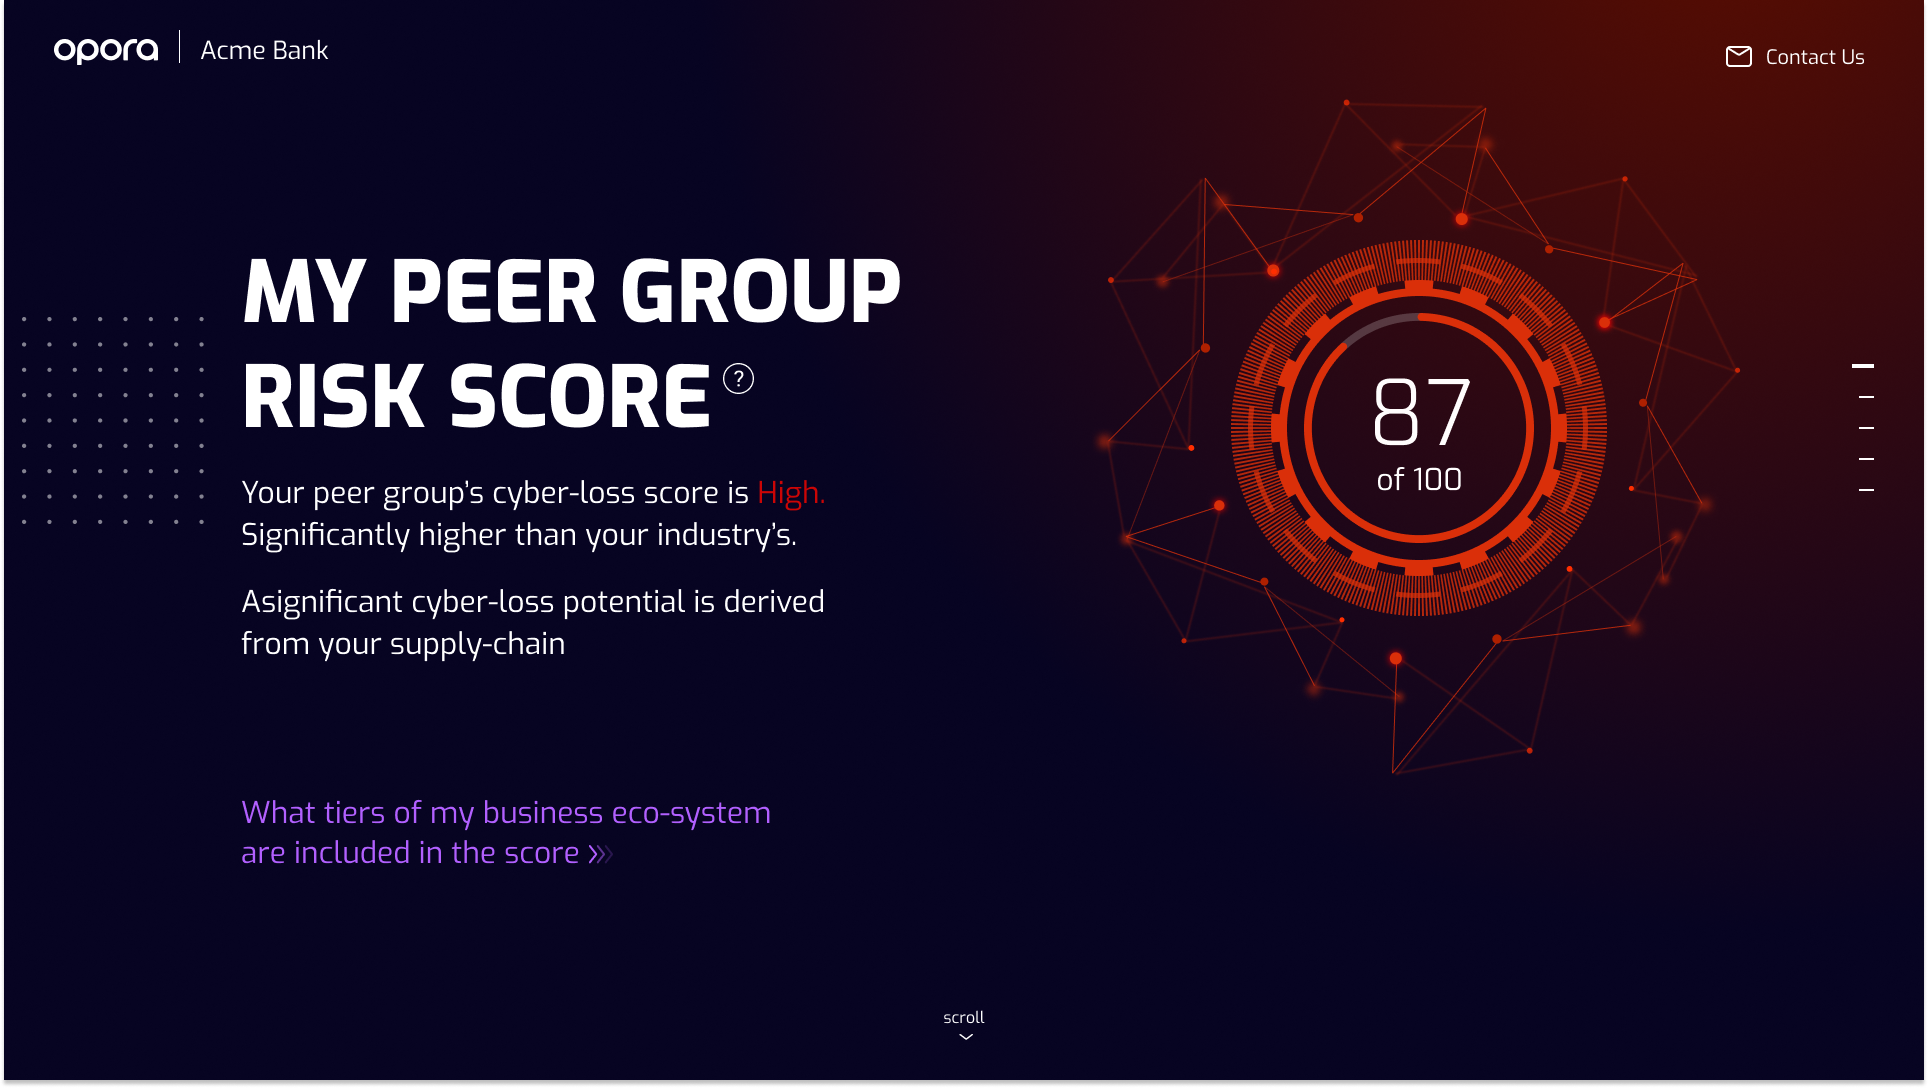
The technology is brilliant – but it created a classic problem: it was a “black box.” It produced a sophisticated risk score, yet the end user – a busy CISO or CRO – had no way to understand how that risk was reasoned.

That’s where we came in. Our job was to take a complex analytical engine and turn it into a transparent, intuitive experience – one that, above all, tells a clear business story.

Project Goal

To translate raw intelligence data and complex risk calculations into a clear executive interface that guides senior users through the full risk journey: from the overall ecosystem score, through the main threat sources and business implications, all the way to a concrete action plan – while creating a strong visual “wow factor” and building trust in the system.

The Challenges

Create a narrative that explains the "black box"

OPORA’s core value is trust and transparency. Explaining how we arrived at the risk score was critical to earning the user’s trust – and their action. The users, CISOs and CROs, are senior executives with no time for data analysis. The challenge was to craft a clear, story-driven narrative that explains the final score – how it behaves over time and against the industry and competitors, what it’s made of and how it’s reasoned – all while striking the delicate balance between too little information and too much.

Translating risk into business implications

The platform can translate threats into “potential losses” – reputational damage, compromised data, financial loss or lost productivity. The challenge was to present that connection visually, credibly and persuasively.

So how do you fix it?

Showing a problem isn’t enough. We had to move users to act and improve the organization’s health. The challenge was to present a prioritized Remediation Plan, demonstrate its ROI, and let users track execution and see how their actions actually affected the organization’s health. That feedback loop is what fueled users to keep acting on the system’s recommendations.

Executive Solution Summary

Executive Solution Summary

We turned a complex cyber ecosystem into a clear, layered visual story that helps users understand the full risk picture at a glance.

Each layer was designed with a distinct visual motif and then connected into one unified view, showing how the different parts of the ecosystem contribute to the overall risk score.

The visual language creates a sense of urgency and supports action, using dark backgrounds, focused lighting, and a severity-based color scale from cold purple to red-hot tones.

Our Process

Group 1707478609
Group 1707478732 (1)
Group 1707478674 (1)

Cracking the persona and identifying the pain

The process began with a deep dive into the end usersCISO and CRO. We realized they don’t need “more data”. They need fast business answers to critical questions. Their core pain is the inability to translate abstract cyber threats into quantified business risk.

.

01
02

A "Storytelling" methodology

Instead of designing a standard dashboard that shows reams of data at once, we chose a narrative approach. We defined a linear, carefully crafted User Journey in which every screen tells a chapter of the story: what the threat is, why it matters, what it means for the business, and how to resolve it.

Efficiency

Our concept lets a user move from a high-level snapshot (“my score is 89”) to a precise business conclusion (“my battery supplier, Panasonic, is jeopardizing the EV project”) in three clicks. That’s the efficiency a C-level user demands.

03

Our Solution

.From the black box to a clear visual story

Smart transparency that builds trust

We simplified the AI algorithm into two clear dimensions: ecosystem layers, such as the organization, users, and suppliers; and potential business impact, such as financial loss, reputation damage, and productivity loss.

This way, users do not just see a score. They understand the reasoning behind it and feel in control of the information.

Business Risk Prioritization

We designed a prioritization model that helps users manage cyber risk according to the organization’s potential business losses, including reputation, productivity, competitive advantage, and financial impact.

For each loss area, companies are positioned on a matrix that compares two key factors: their criticality to the organization and their level of risk exposure. This makes it easier to identify which companies pose the highest business risk and should be addressed first.

By consolidating complex risk data into one clear visual display, we enabled users to quickly understand priorities, support decisions, and take action with greater confidence.